Introduction
In this communication we do not intend to encourage any type of smoking, but seek to identify thermally stable materials for vaporization applications.Many studies have identified cigarette smoking as a prevalent cause of diseases in the body. The chemicals in cigarettes have been proven to be highly toxic to one’s health, and as an alternative, many tobacco users have turned to vape pens and E-cigarettes. These vaporizers are highly versatile and can house most botanical extract oils ranging from nicotine to Tetrahydrocannabinol (THC).
As the vaporizer industry continues to grow, with an estimated compound annual growth rate of 28.1% from 2021 to 2028, new innovation in materials technology must follow. Since the invention of the 510 thread cartridge vaporizer in 2003, metal center-posts have been the industry standard. However, metal components have been suggested to cause heavy metal leaching in vape applications as it comes in direct contact with the botanical oils. This is precisely why the vaporizer industry is in need of material innovation and exploration to replace cheap metallic components.
Ceramics have long been known for their thermal stability due to their highly stable ionic bonding making them a great candidate for material use at elevated temperatures.Zirconia based ceramics are prevalent in the medical field and are used for dental and prosthetic applications lending to their biocompatibility.
In this study we compare a common standard metallic center-post used in vaporizers and a medical grade Zirconia ceramic center-post found in Zirco™. The study will determine the thermal and structural integrity at various elevated temperatures. We then seek to identify any composition or phase changes using x-ray diffraction and Energy dispersive x-ray spectroscopy. Scanning electron microscopy will then be used to study the surface morphology of the Zirconia ceramic center-post and the metal center-post.
Experimental
Wonder Garden Zirconia ceramic center-post cartridges and a leading competitor’s metal center-post cartridges were provided by Wonder Garden for investigation. Samples were sectioned through the length using a low-speed wafering diamond saw (Allied HighTech, US) at 200 rpm to ensure the highest quality cross section is achieved. Then the samples were washed in deionized water in ultrasonic cleaner, then rinsed with isopropanol and DIW for the last time. Samples were then placed in 2 muffle furnaces and kept at 300℃ and 600℃ in air (~Nitrogen 78%, Oxygen 21%, others 1%).
The typical operating temperature of these devices is generally at 250 °C to 350 °C, with a maximum operating temperature ranging from 450 °C to 500 °C. Therefore, considering a safety factor of 1.2, this resulted in evaluation of the material at 600 °C. Characterization methods were carried out on pristine, 300 °C and 600 °C for the ceramic and metal center-posts.
The density was measured employing the gravimetric buoyancy method. X-ray diffraction (XRD) patterns were obtained. Crystal domain size was estimated using the Scherrer equation from XRD diffraction peaks using the full width at half maximum (FWHM) of the (111) peaks. Cross-sectional scanning electron microscopy (SEM) was performed at high vacuum to obtain the highest resolution microstructure images. Energy-Dispersive Spectroscopy (SEM/EDS) were performed for elemental analysis of the samples to investigate if further compositional changes occurred at above the mentioned temperatures.
Results & Discussion
Various experiments and characterization techniques were chosen to target specific areas of interest in the material properties. First, heating and holding the two types of materials at different temperatures can give us an idea of extremes and allow us to understand the capabilities of these materials.After degradation experiments were done, we sought several characterization techniques to identify any changes in the materials composition and structure.
By determining the crystal structure of the pristine samples and identifying planes that the high energy incident radiation are scattering from, we can identify what crystal structure we initially have. We then can do measurements on degraded samples to identify new phase formations in the degraded sample. If the structure and composition of the material changes through these degradation experiments, we will expect to see different peaks in our XRD analysis. This will give us a good idea of what oxides might be forming in degraded samples that are not originally present in the pristine samples.
SEM, a technique that uses electrons to image the surface of the samples, can then be used to inspect the topography of the material at very high resolution. Imaging the surface can give us high resolution insight into how degraded the samples are when compared to pristine samples.If the surface shows detrimental changes to the material, then we can be certain that we should not use these materials at certain temperatures out of fear of material failure. EDS can then be used to identify compositions of various formations on the surface of these materials. We would expect to see surface morphology on areas of the material that have undergone heavy oxidation. EDS will also allow us to identify the percent oxygen content of the degraded material.
Density measurements can then validate the full picture and show physical changes in the materials composition by showing different values for various temperature ranges. We expect to see drastic changes in density if a material has undergone any physical change due to the degradation experiments.The ceramic Zirconia samples should show little to no changes due to the highly stable ionic bonding in the material. This lends to the full story of the ceramic material further being a superior material as it can thermally withstand extreme temperatures and maintain its chemical composition andstructural integrity.
X-Ray Diffraction
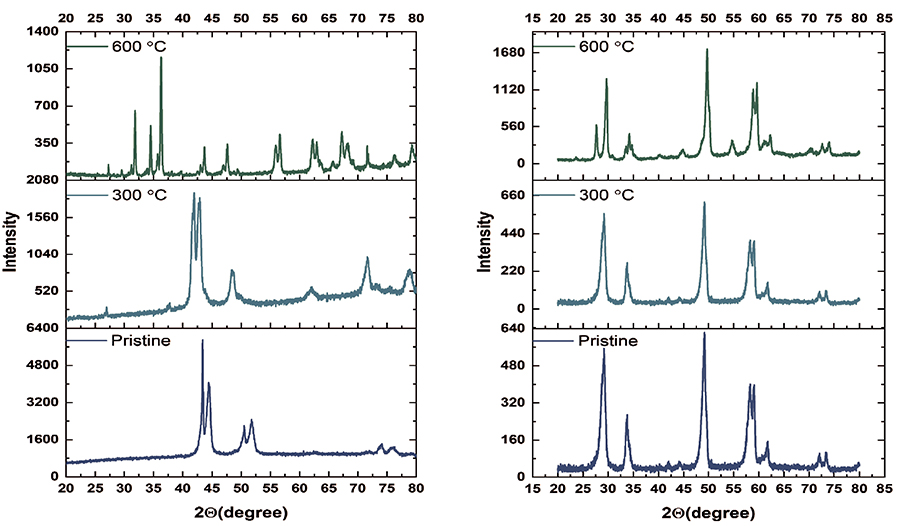
Represents stack plots of the Xray diffraction data on pristine and degraded samples for Metal (left) and Ceramic (Right).
The ceramic center post cartridges, as predicted by the authors, remained consistent in terms of the chemical composition (no sign of decomposition or chemical changes at 300 °C and 600 °C). On the contrary the metal sample undergoes a clear compositional change.
As can be seen by the XRD data, the ceramic samples reflect the structural integrity of the consistent composition. This is an indication of no change in crystal structure as the intensity and peak positions of the diffracting planes remain the same. Using rietveld refinement, we see in our XRD pattern the prominent tetragonal phase which is attributed to the (101) plane. The XRD data also indicates that there is a slight monoclinic structure beginning to arise for the 600 °C sample due to the (111) plane at low angle 2θ. In calculating the mol% from the provided weight% (compositional data provided by Wonder Garden), it was determined that the Zirconia sample is 3 mol% Yttria doped Zirconia. When comparing the XRD pattern to the phase diagram we find that the data collected from XRD is consistent with the phases present in the phase diagram. The result from our XRD data suggests that Zirconia is a highly stable and unreactive material in these temperature ranges.
Witz Et al:Phase Evolution in Yttria-Stabilized Zirconia Thermal Barrier Coatings Studied by Rietveld Refinement of X-Ray Powder Diffraction Patterns.Journal of the American Ceramic Society.
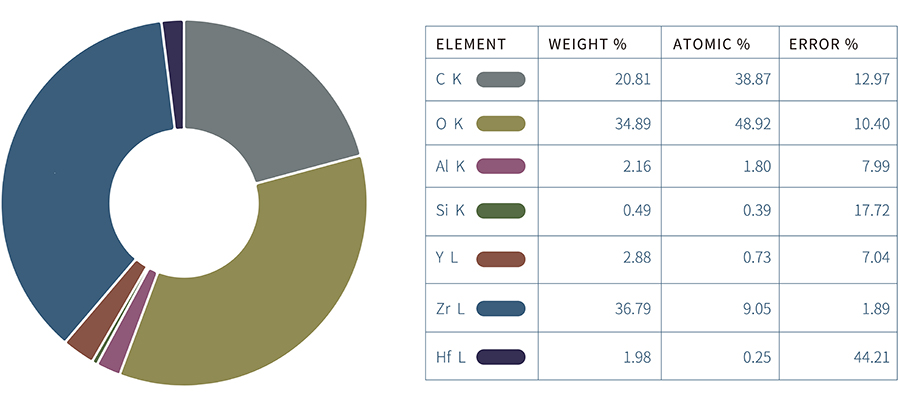
■Table 1 – Composition of the Ceramic Centerpost
From the XRD data, it has been discovered that the metallic material is Brass. For the high temperature applications, it can be a regular choice but as discovered, the degradation happens a lot faster compared to the ceramic center-post. As can be seen in the plot at 600 °C (first plot on the left-hand side), the material undergoes drastic changes. At low angle 2θ, we believe the new peaks are attributed to the formation of ZnO (Zinc Oxide). At 300 °C for the brass sample (left XRD plot) we see that not much of a change has occurred in comparison to the pristine sample. The sample remained in good physical and chemical shape, lending to the materials stability from room temperature to 300 °C.

Energy-Dispersive Spectroscopy
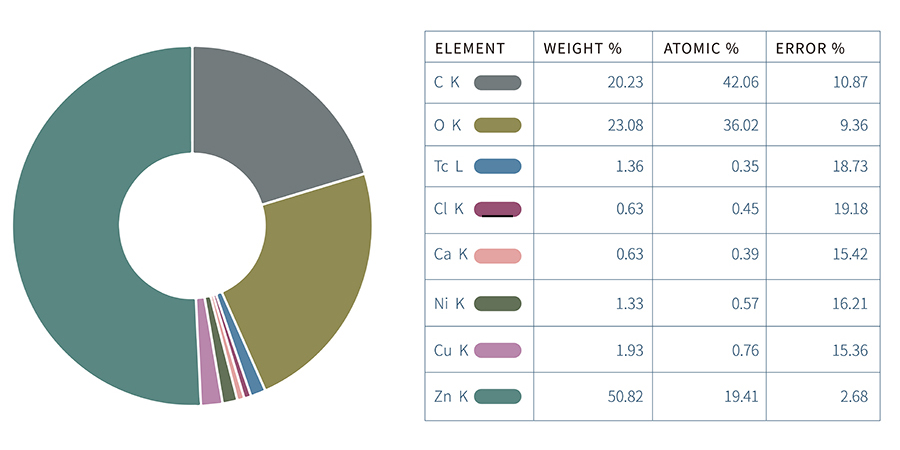
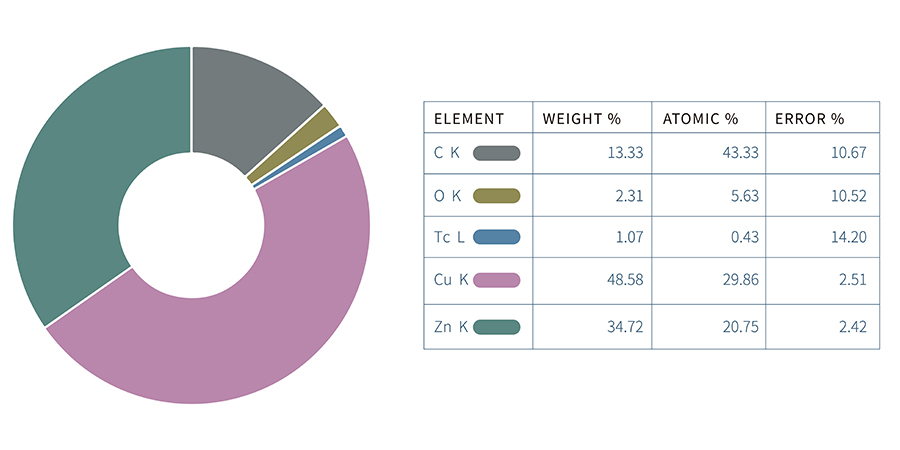
■Figure 4
EDS spectra of Brass samples (Top spectra: Pristine / Bottom spectra: Degraded).
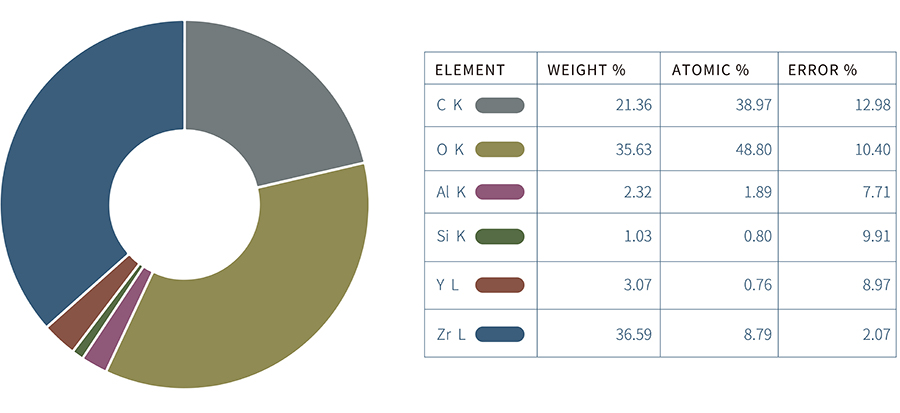
■Figure 5
EDS spectra of Zirconia samples (Top spectra: Pristine / Bottom spectra: Degraded).
EDS spectroscopy was another technique used to characterize the pristine and degraded samples. The elemental mapping of the samples remained consistent for the ceramic centerpost for both pristine and
degraded samples. Only a slight increase in oxidation of the sample was measured. The EDS spectra of the brass on the other hand (Figure. 5), shows a drastic change in percent oxygen in the sample due to the formation of the oxide layers. This indicates degradation of the brass sample that was held at 600 °C.

